Analytics and Report GuideUpdated 3 years ago
Leverage the power of your data collected to provide analytics and insights to improve future decision making. Here's some examples of reports that can quickly be created in a spreadsheet.
Initial Pivot Table Setup
Quick Video Demonstration - https://youtu.be/TI4veuactSE
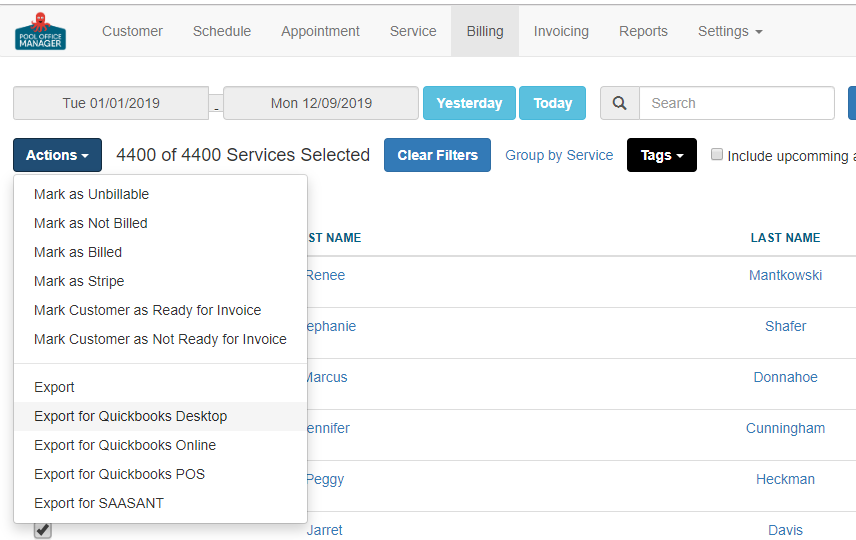
1. On the Billing Page chose your date range and select all services to Export for QuickBooks Desktop (Inventory/Items) or Export (Service Analysis/Chemistry)
Be sure to Don't Mark as Billed, as this is for analytics only.
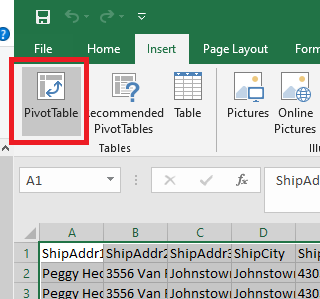
2. Open the downloaded file and Highlight the entire table of data (Press Cntrl and A).
3. Select Insert > PivotTable some programs may have this feature in another location, if you do not have this function, you can use Google Sheets
If completed correctly you'll see a section that now has the ability to add fields into Rows, Columns, Values
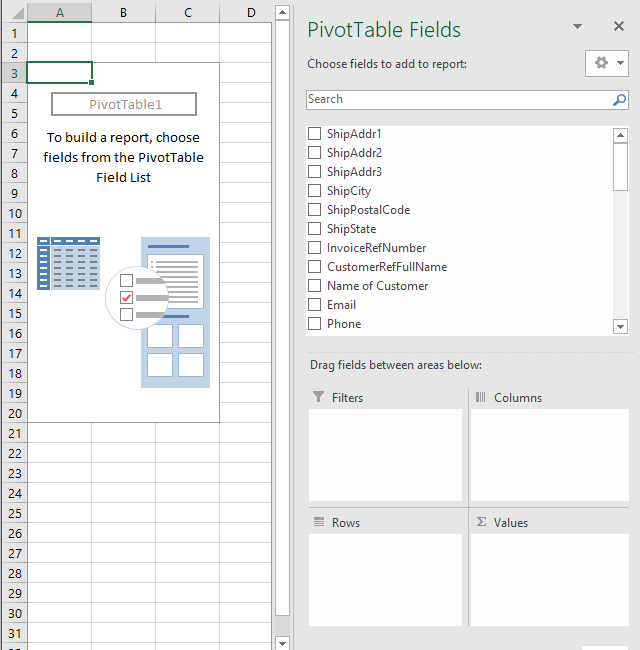
Use the guides below to Drag fields into each section:
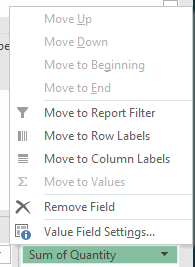
To change the Values from Average, Sum, Count - Select the small arrow next to the field name > Value Field Settings
-------------------------------------------------------
Reports
Items/Inventory - Download 'QuickBooks Desktop Report'
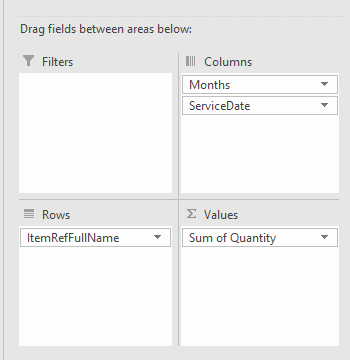
Items Used by Month
Rows - ItemRefFullName
Columns - Service Date (Can group by week/month)
Values - Quantity (Sum)
Compare Items Used versus Active Inventory Items
Rows - ItemRefFullName
Values - Quantity (Sum)
Then you can export your Item list (Settings > Edit Items > Export Items)
In the Inventory Export, add a column to the existing table and title it 'Quantity Used'
Use this formula in the cell beneath:
=Vlookup(C2, [Then Highlight the 2 columns from the PivotTable and insert the comma] ,2,False)
It may end up looking like this: =IFERROR(VLOOKUP(C2,'Sheet2'!A:B,2,FALSE),0)
Service Analysis - Download 'Export'
Average Service Time by Customer
Rows - Customer Name
Columns - Start Time Date (Can group by week/month)
Filters - Service Type - Select desired Service Type
Values - Duration (AVG)
Average Service Time by Type
Rows - Service Type
Columns - Start Time Date (Can group by week/month/day)
Filters -
Values - Duration (AVG)
Total Appointment Counts by Type
Rows - Service Type
Columns - Start Time Date (Can group by week/month/day)
Filters -
Values - Duration (Count)
Chemistry Analysis - Download 'Export'
Average Chemistry Levels for Cleanings by Customer
Rows - Customer Name
Columns - Start Time Date (Can group by week/month)
Filters - Service Type - Select Cleaning Types
Values - pH Reading (AVG), Alkalinity Reading (AVG), etc.....
Average Chemistry Levels at Openings or Closings
Rows - Service Type
Columns - Start Time Date (Can group by week/month)
Filters - Service Type - Select Cleaning Types
Values - pH Reading (AVG), Alkalinity Reading (AVG), etc.....